With under three weeks to the 2025 MLB trading deadline, trade discussions will begin to heat up between teams, beat reporters will stir speculation and names will inevitably be dealt. Front offices are in the thick of evaluating their current rosters, determinining whether or not the team is ready for the playoffs. One of the key positions year in and year out at the deadline is relief pitcher. Bullpens can often make or break a baseball team. Managers want reliable arms in important moments. This year, there is no shortage of teams that are in need of bullpen help.
Who’s Buying? Who’s Selling?
Before we get into which teams need bullpen help, let’s take a look at the standings as we head into the All-Star break.
Team | Record (Division) (Wild Card) | RD | L10| Streak
NL East
Phillies | 55-41 | RD: +63 | 5-5 | W1
Mets | 55-42 (-0.5) (+2.5) | RD: +45 | 6-4 | L1
Marlins | 44-51 (-10.5) (-7.5) | RD: -55 | 5-5 | W2
Braves | 42-53 (-12.5) (-9.5) | RD: +2 | 3-7 | L1
Nationals | 38-58 (-17.0) (-14.0) | RD: -102 | 2-8 | L4
NL Central
Cubs | 57-39 | RD: +119 | 6-4 | W2
Brewers | 56-40 (-1.0) (+4.0) | RD: +81 | 8-2 | W7
Cardinals | 51-46 (-6.5) (-1.5) | RD: +17 | 4-6 | W1
Reds | 50-47 (-7.5) (-2.5) | RD: +31 | 5-5 | W2
Pirates | 39-58 (-18.5) (-13.5) | RD: -53 | 2-8 | W1
NL West
Dodgers | 58-39 | RD: +69 | 3-7 | W2
Padres | 52-44 (-5.5) (-) | RD: +7 | 6-4 | L1
Giants | 52-45 (-6.0) (-0.5) | RD: +17 | 6-4 | L2
D-Backs | 47-50 (-11.0) (-5.5) | RD: +5 | 4-6 | W1
Rockies | 22-74 (-35.5) (-30.0) | RD: -253 | 3-7 | L2
AL East
Blue Jays | 55-41 | RD: +119 | 7-3 | L2
Yankees | 53-43 (-2.0) (+2.0) | RD: +119 | 5-5 | L2
Red Sox | 53-45 (-3.0) (+1.0) | RD: +61 | 10-0 | W10
Rays | 50-47 (-5.5) (-1.5) | RD: +61 | 2-8 | L4
Orioles | 43-52 (-11.5) (-7.5) | RD: -90 | 6-4 | L2
AL Central
Tigers | 59-38 | RD: +87 | 5-5 | L4
Twins | 47-49 (-11.5) (-4.0) | RD: -8 | 6-4
Royals | 47-50 (-12.0) (-4.5) | RD: -28 | 7-3
Guardians | 46-49 (-12.0) (-4.5) | RD: -45 | 6-4
White Sox | 32-65 (-27.0) (-19.5) | RD: -98 | 4-6
AL West
Astros | 56-40 | RD: +56 | 4-6 | L1
Mariners | 51-45 (-5.0) (-) | RD: +32 | 6-4 | W3
Rangers | 48-49 (-8.5) (-3.5) | RD: +47 | 5-5 | W1
Angels | 47-49 (-9.0) (-4.0) | RD: -62 | 4-6 | L1
Athletics | 41-57 (-16.0) (-11.0) | RD: -134 | 5-5 | W2
Which Teams Need Bullpen Help?
Let’s now begin to get into the weeds a little bit and understand which of these playoff-contending teams needs bullpen help the most.
The Metrics:
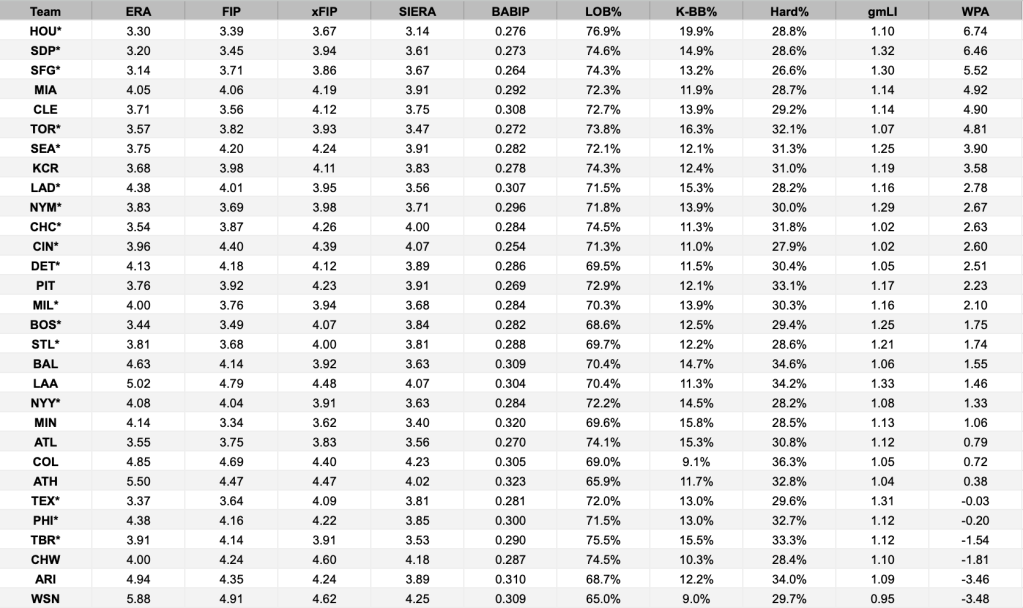
Above is a spreadsheet with FanGraphs data on every MLB team’s bullpen. I chose to include ERA, FIP, xFIP, SIERA, BABIP, LOB%, K-BB%, HardHit%, gmLI (average game leverage index), and WPA (win probability added) because these statistics can accurately paint a picture of strengths and weaknesses of a relief staff. One can go deeper into the numbers, and I may do so later, however these numbers should suffice for now.
ERA, FIP, xFIP, SIERA — Outcome and predictive run-prevention metrics.
BABIP — Are balls in play falling for hits?
LOB% — Are relievers stranding runners?
K-BB% — How efficient are relievers at missing bats and limiting walks?
Hard-Hit % — Are hitting squaring their pitches up?
gmLI — How often are they being used in high-leverage situations?
WPA — Are they helping or hurting their team’s chances of winning?
With that out of the way, let’s get into the five contenders in need of bullpen arms the most.
Philadelphia Phillies
Bullpen Performance:
| ERA | FIP | xFIP | SIERA | BABIP | LOB% | K-BB% | Hard% | gmLI | WPA |
| 4.38 | 4.16 | 4.22 | 3.85 | 0.300 | 71.5% | 13.0% | 32.7% | 1.12 | -0.20 |
If the Phillies want to have a serious chance at a playoff run, they must make moves in their bullpen.
A 4.38 bullpen ERA isn’t good. The underlying numbers don’t disagree — a FIP of 4.16 and xFIP of 4.22 indicate a need to address the pen.
The Phillies have been particularly vulnerable to the home run, with the relievers giving up 1.2 HR/9. 32.7% of their balls in the play are hard-hit, which places them with the 8th highest hard hit rate in the MLB. Pair that with a mediocre strand rate of 71.5% and you can see the clear underperformance.
These numbers do matter. A 1.12 gmLI an -0.20 WPA shows Phillies’ relievers are not coming through in the most important moments of the game. They’ve hurt the team’s chances of winning.
These Phillies need difference-makers in the bullpen, as the numbers say they can’t rely on a bounceback second half.
Tampa Bay Rays
Bullpen Performance:
| ERA | FIP | xFIP | SIERA | BABIP | LOB% | K-BB% | Hard% | gmLI | WPA |
| 3.91 | 4.14 | 3.91 | 3.53 | 0.290 | 75.5% | 15.5% | 33.3% | 1.12 | -1.54 |
The Rays’ bullpen profile similarly to the Phillies’. A 3.91 ERA, coupled with a 4.14 FIP, 3.91 xFIP and 3.53 SIERA show that they are performing just about where they are expected to be.
Those numbers don’t jump off the screen, but the Rays should still be concerned for a few reasons.
Firstly, they hold the second-best LOB% of 75.5% in the majors. This effectiveness with runners on base has certainly helped them succeed, but they shouldn’t count on this level of clutch to continue at such a high rate.
Batted balls are getting scorched. Their hard-hit rate of 33.3% is 5th-highest in the majors, and it’s impressive to think that their BABIP is only .290, until you realize they give up the fourth-most home runs in the MLB (1.29 HR/9)
This group is also not getting it done when it matters most. A 1.12 gmLI combined with a -1.54 WPA (worst among buyers) shows that their bullpen is weak.
Stranding runners while giving up loud contact is a house of cards. If the Rays want to hold onto their wild card aspirations, adding a stabilizer in the late innings should be high on the priority list.
Seattle Mariners
Bullpen Performance:
| ERA | FIP | xFIP | SIERA | BABIP | LOB% | K-BB% | Hard% | gmLI | WPA |
| 3.75 | 4.20 | 4.24 | 3.91 | 0.282 | 72.1% | 12.1% | 31.3% | 1.25 | 3.90 |
On paper, Seattle’s bullpen has been productive. A 3.75 ERA and a +3.90 WPA (7th-best in MLB) show they’ve contributed meaningfully to wins — especially in high-leverage spots, with a gmLI of 1.25. But upon closer inspection, there are reasons to be doubtful.
Their 3.75 bullpen ERA ranks 11th in the majors, but every underlying stat says worse days may be ahead: 4.20 FIP, 4.24 xFIP and 3.91 SIERA.
On top of this, the Mariners struggle a bit with control: a 12.1% K-BB rate is below average–they’re walking 9.4% of batters–and when their pitches do find bats, they’re getting hit hard at a 31.3% clip.
So, again, the Mariners’ bullpen has been good, but they’ve been overachieving. The cracks are visible in their control and their ability to mitigate hard contact. They would do well to fill those needs at or before the deadline to make a push for October.
Boston Red Sox
Bullpen Performance:
| ERA | FIP | xFIP | SIERA | BABIP | LOB% | K-BB% | Hard% | gmLI | WPA |
| 3.44 | 3.49 | 4.07 | 3.84 | 0.282 | 68.6% | 12.5% | 29.4% | 1.25 | 1.75 |
The Red Sox bullpen definitely looks better than it actually is. What club wouldn’t be happy with a 3.44 bullpen ERA? The problem is this bullpen is built on shaky ground.
The Sox have allowed the fewest home runs in the league (HR/FB rate at 7.0%; HR/9 at 0.63) and any realistic baseball mind would not expect them to continue that the rest of the year. Meanwhile, Red Sox relievers are walking about 10% of batters and struggling to strand baserunners (68.6% LOB%, 3rd-worst in MLB).
Despite the concerns, their relievers are entering high-leverage innings and helping the team win (1.25 gmLI; 1.75 WPA). They will need relievers with command and relievers that can close out innings with runners on base to continue to assert themselves as World Series contenders.
Cincinnati Reds
Bullpen Performance:
| ERA | FIP | xFIP | SIERA | BABIP | LOB% | K-BB% | Hard% | gmLI | WPA |
| 3.96 | 4.40 | 4.39 | 4.07 | 0.254 | 71.3% | 11.0% | 27.9% | 1.02 | 2.60 |
Among all contenders, the Reds might be the most deceptive bullpen story. At face value, their ERA sits under 4.00 and their WPA is +2.60. But they’re skating on thin ice. The advanced stats — 4.40 FIP, 4.39 xFIP, and 4.07 SIERA — paint a very different picture.
The biggest issue is a .254 BABIP and the success that comes with it, both of which are not sustainable.
An 11.0% K-BB rate makes things even more clear: The Reds relievers are not missing enough bats, especially when they’re already walking over 10% of hitters.
Despite being 3 games over .500 and only 2.5 games out of the last wild card spot, the Reds have a major need that requires immediate addressing if they want to continue being respected this year. These numbers scream regression and are waving a massive red flag in front of the front office, who must decide what they can do to improve the unit, so that implosion is not their impending doom. Don’t be surprised if they make a trade for a high-leverage, big time strikeout flamethrower for the wild card push.
