
With the culmination of the 2026 MLB season (congratulations, Milwaukee!), we have a full season of data on the automatic ball-strike system (ABS). I wrote about the ABS system entering baseball back in April, attempting to calm the nerves of skeptics. Human umpires still played a pivotal role each and every day. ABS has simply added an element to the game of baseball, giving the hitters, pitchers, and catchers with elite knowledge of the strike zone an opportunity for reward.
For a refresher on the ABS system, take this from Baseball Savant’s ABS Dashboard:
“What to know about the challenge system and how it works:
- Only batters and pitchers/catchers may initiate a challenge. Managers, coaches and other players may not be involved.
- Each team starts the game with two challenges. Teams will lose the ability to challenge after they do so incorrectly twice. Teams will start each extra inning with a challenge regardless of whether they have already exhausted their challenges in the first nine innings.
- The ABS zone is set as follows: The width is 17 inches, identical to home plate. The top of the zone is set at 53.5% of a player’s measured height without cleats. The bottom is set at 27% of the player’s measured height. The strike zone is captured as the ball passes through the middle of the plate, not the front.
- In MLB, challenges will not be permitted when a position player is pitching.”
Now, let’s take a look at what the numbers say about ABS’s debut season in MLB.
THE NUMBERS
Note that we’re solely looking at the regular season data. Perhaps I’ll write another piece on the playoffs data.
Here are some numbers that give a summary of the season:
- In all, there were 10,556 ABS challenges this season.
- Catchers accounted for 5,609 total challenges, batters 4,765, and pitchers 182.
- Catchers accounted for 53% of total challenges, batters 45%, and pitchers just 1.7%.
- Catchers were successful nearly 59% of the time, batters nearly 49% of the time, and pitchers just under 40% of the time.
- The Twins led MLB with 450 total challenges, while the Cardinals brought up the rear with just 285 total challenges.
- The Reds led MLB with a 62% success rate (on 370 challenges), while the Pirates were last with a 47% rate (on 355 challenges).
- The leading challengers amongst hitters, catchers, and pitchers were:
- Hitter: CIN 1B Sal Stewart (51 challenges)
- Catcher: MIL C William Contreras (185)
- Pitcher: DET SP/RP Drew Anderson and NYM/TB SP Freddy Peralta (8)
- Amongst hitters/catchers with at least 20 challenges, the best success rates were:
- Hitter: ARI C Gabriel Moreno (68% success rate = 17/25 challenges won)
- Catcher: PHI C JT Realmuto (81% success rate = 70/86 challenges won)
That’s a lot of numbers at face-value, but let’s dive into them a little.
- The astounding lack of pitcher challenges
Pitcher challenges, or lack thereof, jump out to me. There were only 182 challenges by pitchers across the entire regular season. That comes out to 1.7% of the 10,556 total challenges.
I think people expected pitchers to be less active on the challenge front, leaving that to their catchers. It’s my opinion that, as a pitcher, you tend to think your pitches are better than they are in reality. A lot of great pitchers have humility, but the best were able to tap into an advantageous ego. That ego could definitely lead to many poor ABS decisions on the part of the pitcher. Another factor worth mentioning is that pitchers are some of the most superstitious athletes in sports, and adding the mental effort of determining whether to challenge a ball-strike call could prove detrimental to a pitcher’s performance. All of this is just my opinion, though, as someone that grew up pitching.
There were only 10 pitchers with 4 or more challenges. Drew Anderson and Freddy Peralta led the way with 8 apiece, winning 5 and 4 of those challenges, respectively. Pirates reliever Gregory Soto followed with 6, winning 2. Four pitchers had 5 challenges and three had 4. Six of those ten “challenge-happy” pitchers were starting pitchers. Drew Anderson didn’t make the first of his 11 starts until August, pitching out of the bullpen in the first half of the year.
To sum it up, it wasn’t surprising pitchers trailed hitters and catchers in challenges. The mental side of pitching can cloud judgment, and it’s best for pitchers to have less on their mind while on the bump, instead just focusing on the hitter in the box. What will be worth watching going forward is if the trend continues this severely.
- Catchers varied on their aggressiveness
William Contreras of the Brewers led all catchers with 185 challenges, 49 more than the guy with the second-most. Tyler Stephenson and Patrick Bailey followed Contreras with 136 with 135, respectively.
Contreras led MLB, appearing at catcher in 128 games (of which 121 were starts). With a total of 1,085.2 innings at catcher this year, Contreras was averaging about .17 challenges per inning. Meanwhile, in the American League, the appearance leader was Austin Wells with 122 games appearing at catcher, totaling 959.1 innings on the season. With 131 challenges, Wells comes out to just under .14 challenges-per-inning.
It’s interesting to boil it down to a simple challenges-per-inning metric. Not every catcher is going to have the same amount of challenge-able pitches, but also isn’t going to have the same amount of situations that would require using a challenge. Challenges aren’t going to be as common in lower-leverage spots. For example, a challenge isn’t as necessary in a 10-0 blowout in the 9th inning as it would be in a late, bases-loaded situation in a tied game. This challenges-per-inning number gives us a general idea of who was tapping their helmet more often than others.
Check out the following table, depicting the challenges-per-inning of all 43 catchers that played at least 500 innings at the position this year:
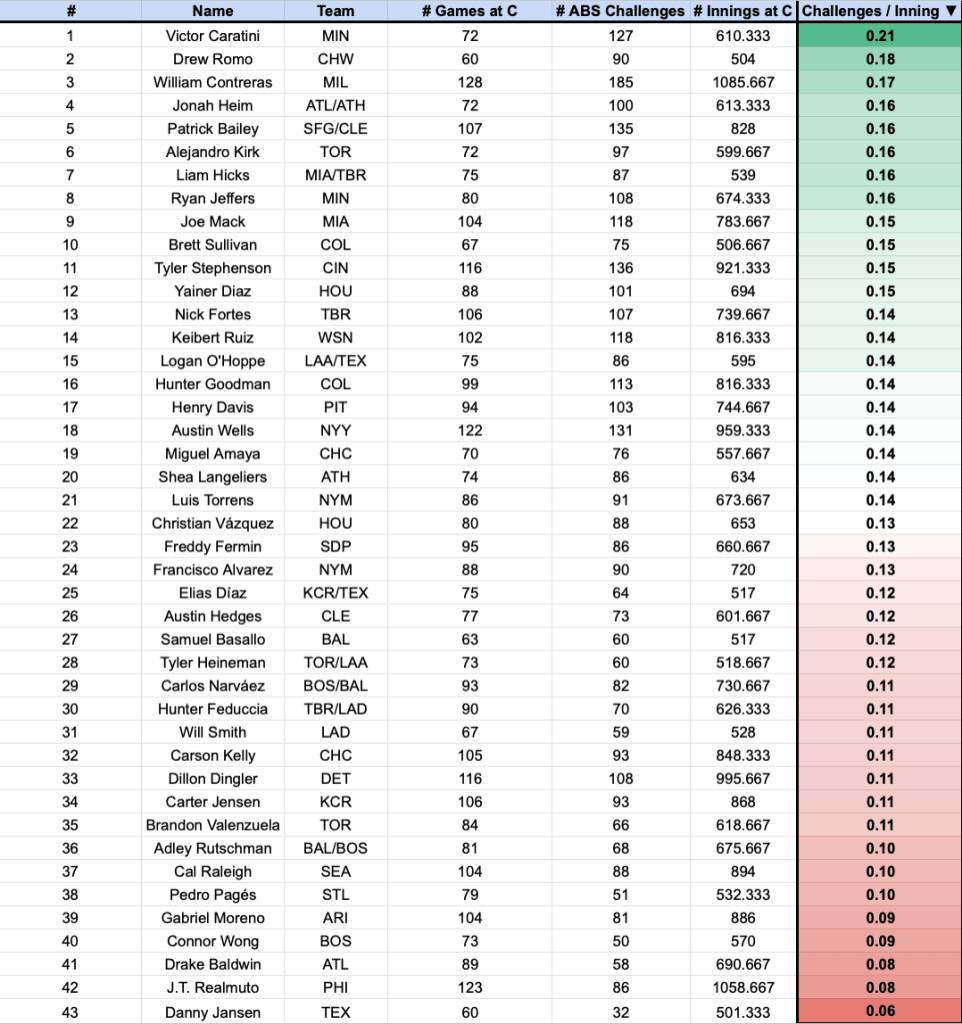
Victor Caratini led the way with 0.21 challenges-per-inning, leading Drew Romo (0.18) and Contreras (.17). At the back-end, Danny Jansen’s 0.06 challenges-per-inning was last among catchers with 500+ innings. JT Realmuto had the 2nd-fewest challenges-per-inning, notable because he was the best challenger at catcher by success rate (81%), successfully overturning 70 of 86 calls.
Challenges-per-inning allows us to get a better idea of ABS aggressiveness by catchers.
- Did ABS strategy have any correlation to team results?
A question that came to mind as I was doing my research was whether a team’s ABS strategy correlated to on-field success. I took a quick look at this by visualizing a team’s win count against both their total ABS challenges and against their ABS challenge success rate. Those two visualizations (A and B) can be seen here:
A) B)
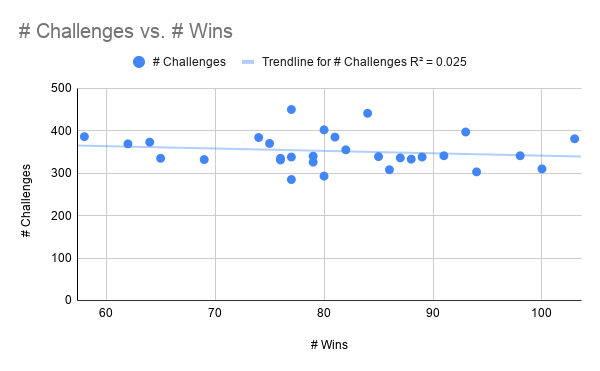
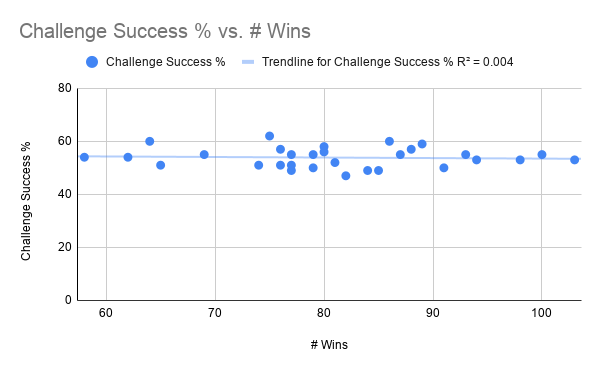
Just by taking a brief look at the shape of the trend, one can deduce that there is no relationship of significance between a team’s challenge data and their regular season success in wins. Chart A’s r2 of 0.025 and chart B’s r2 of 0.004 confirm as much.
It’s interesting when you realize the Cincinnati Reds, who had a league-best 62% success rate on their ABS challenges, won just 75 games. On the other end, the Milwaukee Brewers (the eventual World Series champions), won an MLB-best 103 games with a success rate of 53%.
Based on the data, my opinion is it’s unlikely that clubs with elite ABS-challengers will ever see a dramatic impact on their win total. I think that, at most, an elite ABS-challenger will be worth one win for their squad.
- How do teams go forward evaluating players’ challenging ability?
Just like with any evolution of the game, ABS may begin altering how front offices operate around the league.
Based on the data above, I believe the catcher position has the biggest impact when it comes to the ABS system. They accounted for 844 more challenges than hitters and were successful at a rate 10 percentage points better than hitters. How will a catcher with proven ABS success be valued by clubs going forward?
Take William Contreras, for example, the league-leading catcher in challenges with a 57% success rate. He’s scheduled to hit free agency after next season. Will his price tag be affected significantly by his ABS results? Or will its impact on the price tag be as small as its impact is on a team’s win total?
To wrap it up…
A season in, it feels as though ABS has become an integral part of the game of baseball at the big-league level. The system has developed into something not as invasive as skeptic traditionalists feared and has become one of the more exciting facets of any MLB game.
Human umpires still reign supreme, as they still hold ownership over the initial ball-strike call, plays on the basepaths, and other critical components of the on-field baseball product. What the future holds, however, remains to be seen.

